Voxeleron has now released three Optical Coherence Tomography (OCT) analysis applications, each of which incorporates absolute state-of the-art computer vision and machine learning algorithms, resulting in the most advanced OCT analysis software currently available. All are available for research purposes only and may not be used clinically.
Our flagship product is Orion™, which offers device-independent OCT image analysis software. Orion is compatible with all the major OCT devices, and offers far superior analysis software and review tools than those available and shipped with the devices themselves. Check out the extensive publication list here and contact us today if you are interested in finding out more. While it is not FDA approved for clinical use, it is ideal for use in clinical trials as it is the fastest, most accurate way to get to OCT-based endpoints, regardless of the imaging device.
Given Orion’s ability to support all OCT formats, our roadmap includes pushing its functionality to the cloud and housing a PACS system in support of data management. This introduces iNebula™, which once approved, will support both research and clinical use cases for efficient, true vendor neutral, OCT data management, functionality not available elsewhere. Given this is a pressing unmet need, Nebula’s development is supported by an NIH (NCATS) award of $1.6M.
Additionally, we have released two applications for animal OCT and are non-exclusively licensed to Phoenix Research Labs, leaders in animal imaging. These are InSight and InSight 3d, respectively. More details are below.
Orion™
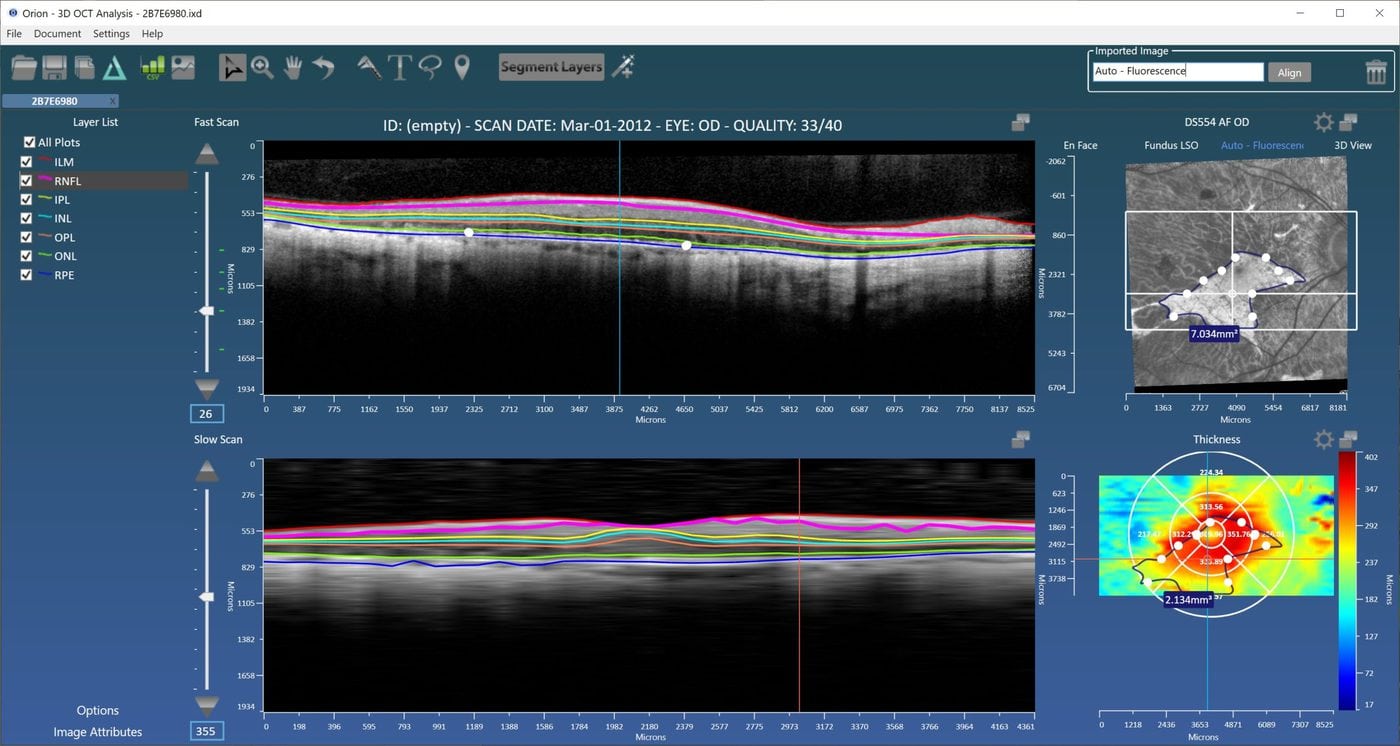
Voxeleron’s Orion is state-of-the-art, award-winning optical coherence tomography (OCT) research software. Orion is fully automated, rapidly and accurately segmenting up to eight retinal layers in OCT images.
The limited functionality and poor performance of existing OCT analysis tools has meant that only two or three retinal layers are analyzed, very slowly, and often erroneously. Comparison of results across different scanners is impossible, and functionality such as visualization, annotations and layer editing are rudimentary at best.
Orion addresses all of these technology gaps, providing clinical researchers with exactly the analysis tools they need. Being device-independent, Orion processes data from all the main OCT vendors, paving the way for multi-center trials involving biomarkers used in the detection and management of both ocular and neurological diseases. More details can be found on our Orion™ product page, here.
iNebula™
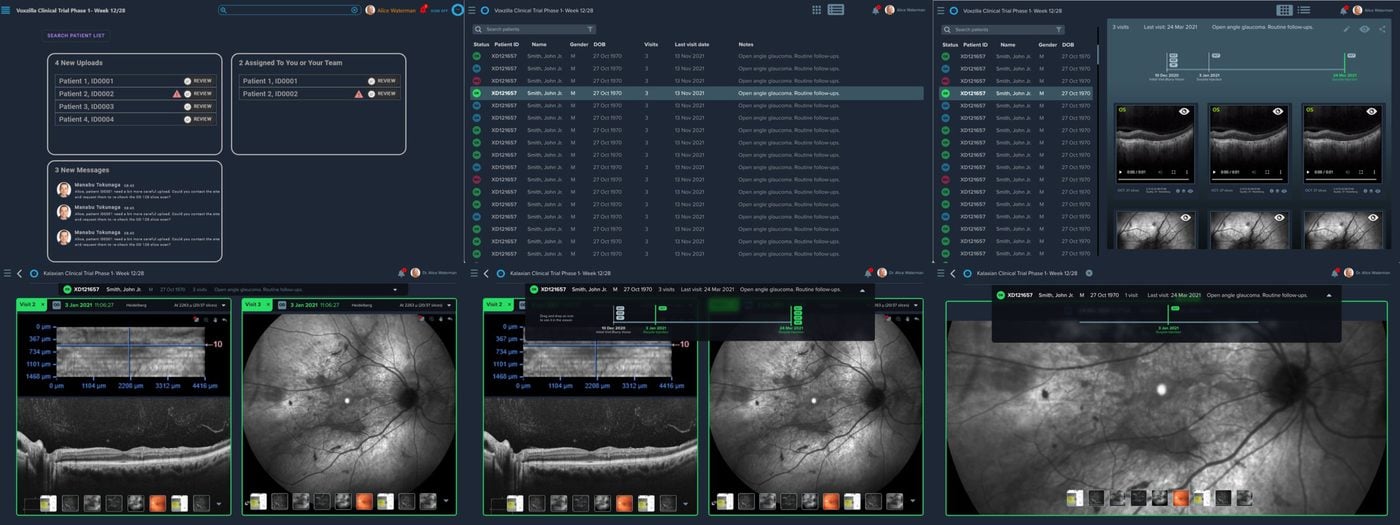
iNebula is a truly vendor neutral archive (VNA), the first of its kind for OCT data. This cloud-based system scales to your needs and is ideal for storing and reading ophthalmic data, in particular OCT images, from any source and anywhere. Currently, it fits an extremely important research role in managing data that could be used for clinical research and in clinical trials. Its built in and customizable electronic case report forms (eCRFs) are part of our 21 CFR Part 11 compliance that touches all aspects of iNebula’s electronic record keeping. More details can be found on our iNebula product page, here.
InSight 2d
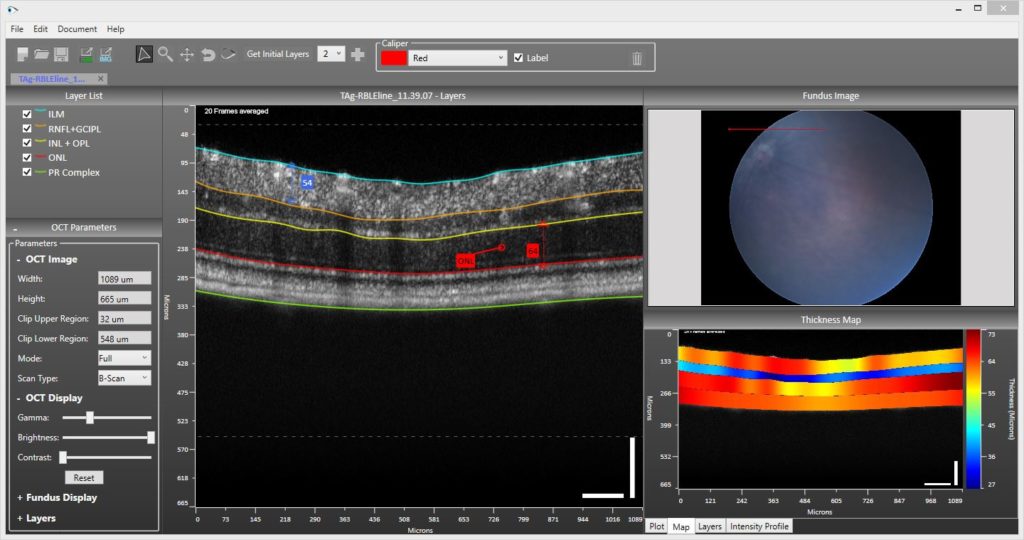
The InSight application is software developed for use with Phoenix Research Labs (PRL) Image-Guided Tomography OCT systems. It is solely for the analysis of retinal OCT images taken for animal studies. These images are 2-d slices, or tomograms, through a retinal volume of interest. Being made up of differing neuronal layers, the core aspect of the analysis is retinal layer thickness measurements. With this in mind, the InSight software allows the user to:
- Automatically segment between 2 and 4 retinal layers.
- Edit / Delete / Add layers.
Up to 10 layers are may be analyzed. Various reports and images may be created based on the analysis:
- Excel spreadsheets given all layer positions and thicknesses.
- Images showing the segmented layers overlaid on the original data.
- Thickness plots or maps.
- Intensity profiles through the retinal layers.
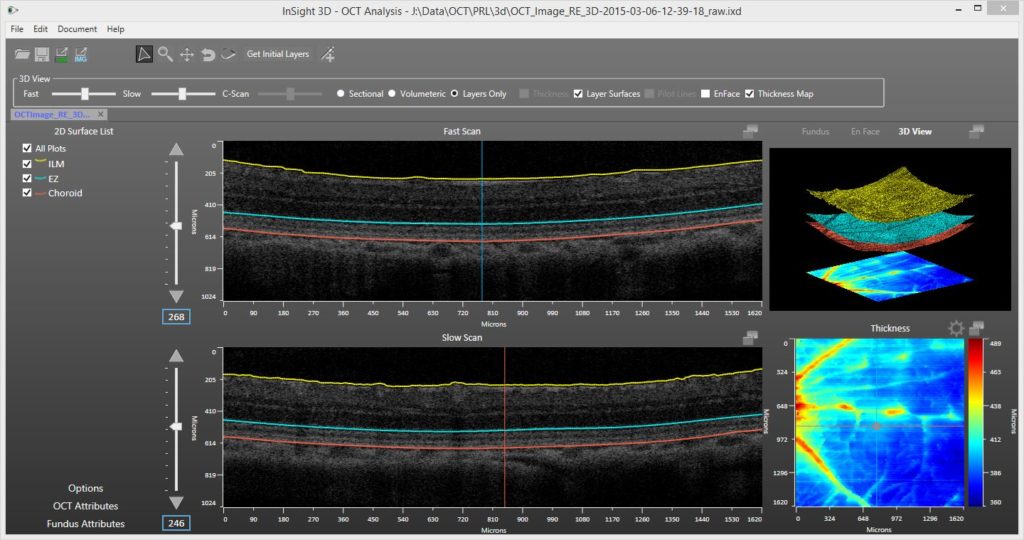
InSight 3d
InSight 3d extends upon the 2d offering, based on the better imaging capabilities offered by PRL. As well as being able to automatically segment retinal layers, the fully 3d functionality allows this do be done over entire volumes, in seconds, thereby creating surfaces and thickness maps. Layer volume can be analyzed and exported. Additionally, to cope with the much larger data sets, InSight 3d also offers:
- 3dEdit™ – the ability to edit existing and add new surfaces covering the entire volume in an intelligent way. This drastically reduces the laborious task of editing layers in volumes and is patent pending technology.
- 3d Visualization – the ability to render volumes and their segmentations offering a unique and informative way of assessing the data in all its glory.